Welcome to xyzpy’s documentation!
![]()
![]()


xyzpy is python library for efficiently
generating, manipulating and plotting data with a lot of dimensions, of the
type that often occurs in numerical simulations. It stands wholly atop the
labelled N-dimensional array library xarray. The
project’s documentation is hosted on readthedocs.
The aim is to take the pain and errors out of generating and exploring data with a high number of possible parameters. This means:
you don’t have to write super nested for loops
you don’t have to remember which arrays/dimensions belong to which variables/parameters
you don’t have to parallelize over or distribute runs yourself
you don’t have to worry about loading, saving and merging disjoint data
you don’t have to guess when a set of runs is going to finish
you don’t have to write batch submission scripts or leave the notebook to use SLURM, PBS or SGE
you don’t have to lose progress if your run is interrupted
you don’t have to fiddle with
CUDA_VISIBLE_DEVICESortasksetto assign GPU devices or CPU cores to different runs
To this data generation functionality, xyzpy adds a simple plotting
interface accessed via ds.xyz.plot()
that automatically maps dataset dimensions to visual elements including color,
marker, marker size, line style, line width, subplot rows and columns, and text
annotations. It also adds various other utilities for timing and tracking
memory usage, and for visualizing matrices and high dimensional tensors.
Overview
The following guides introduce the main parts of xyzpy:
Quick-start
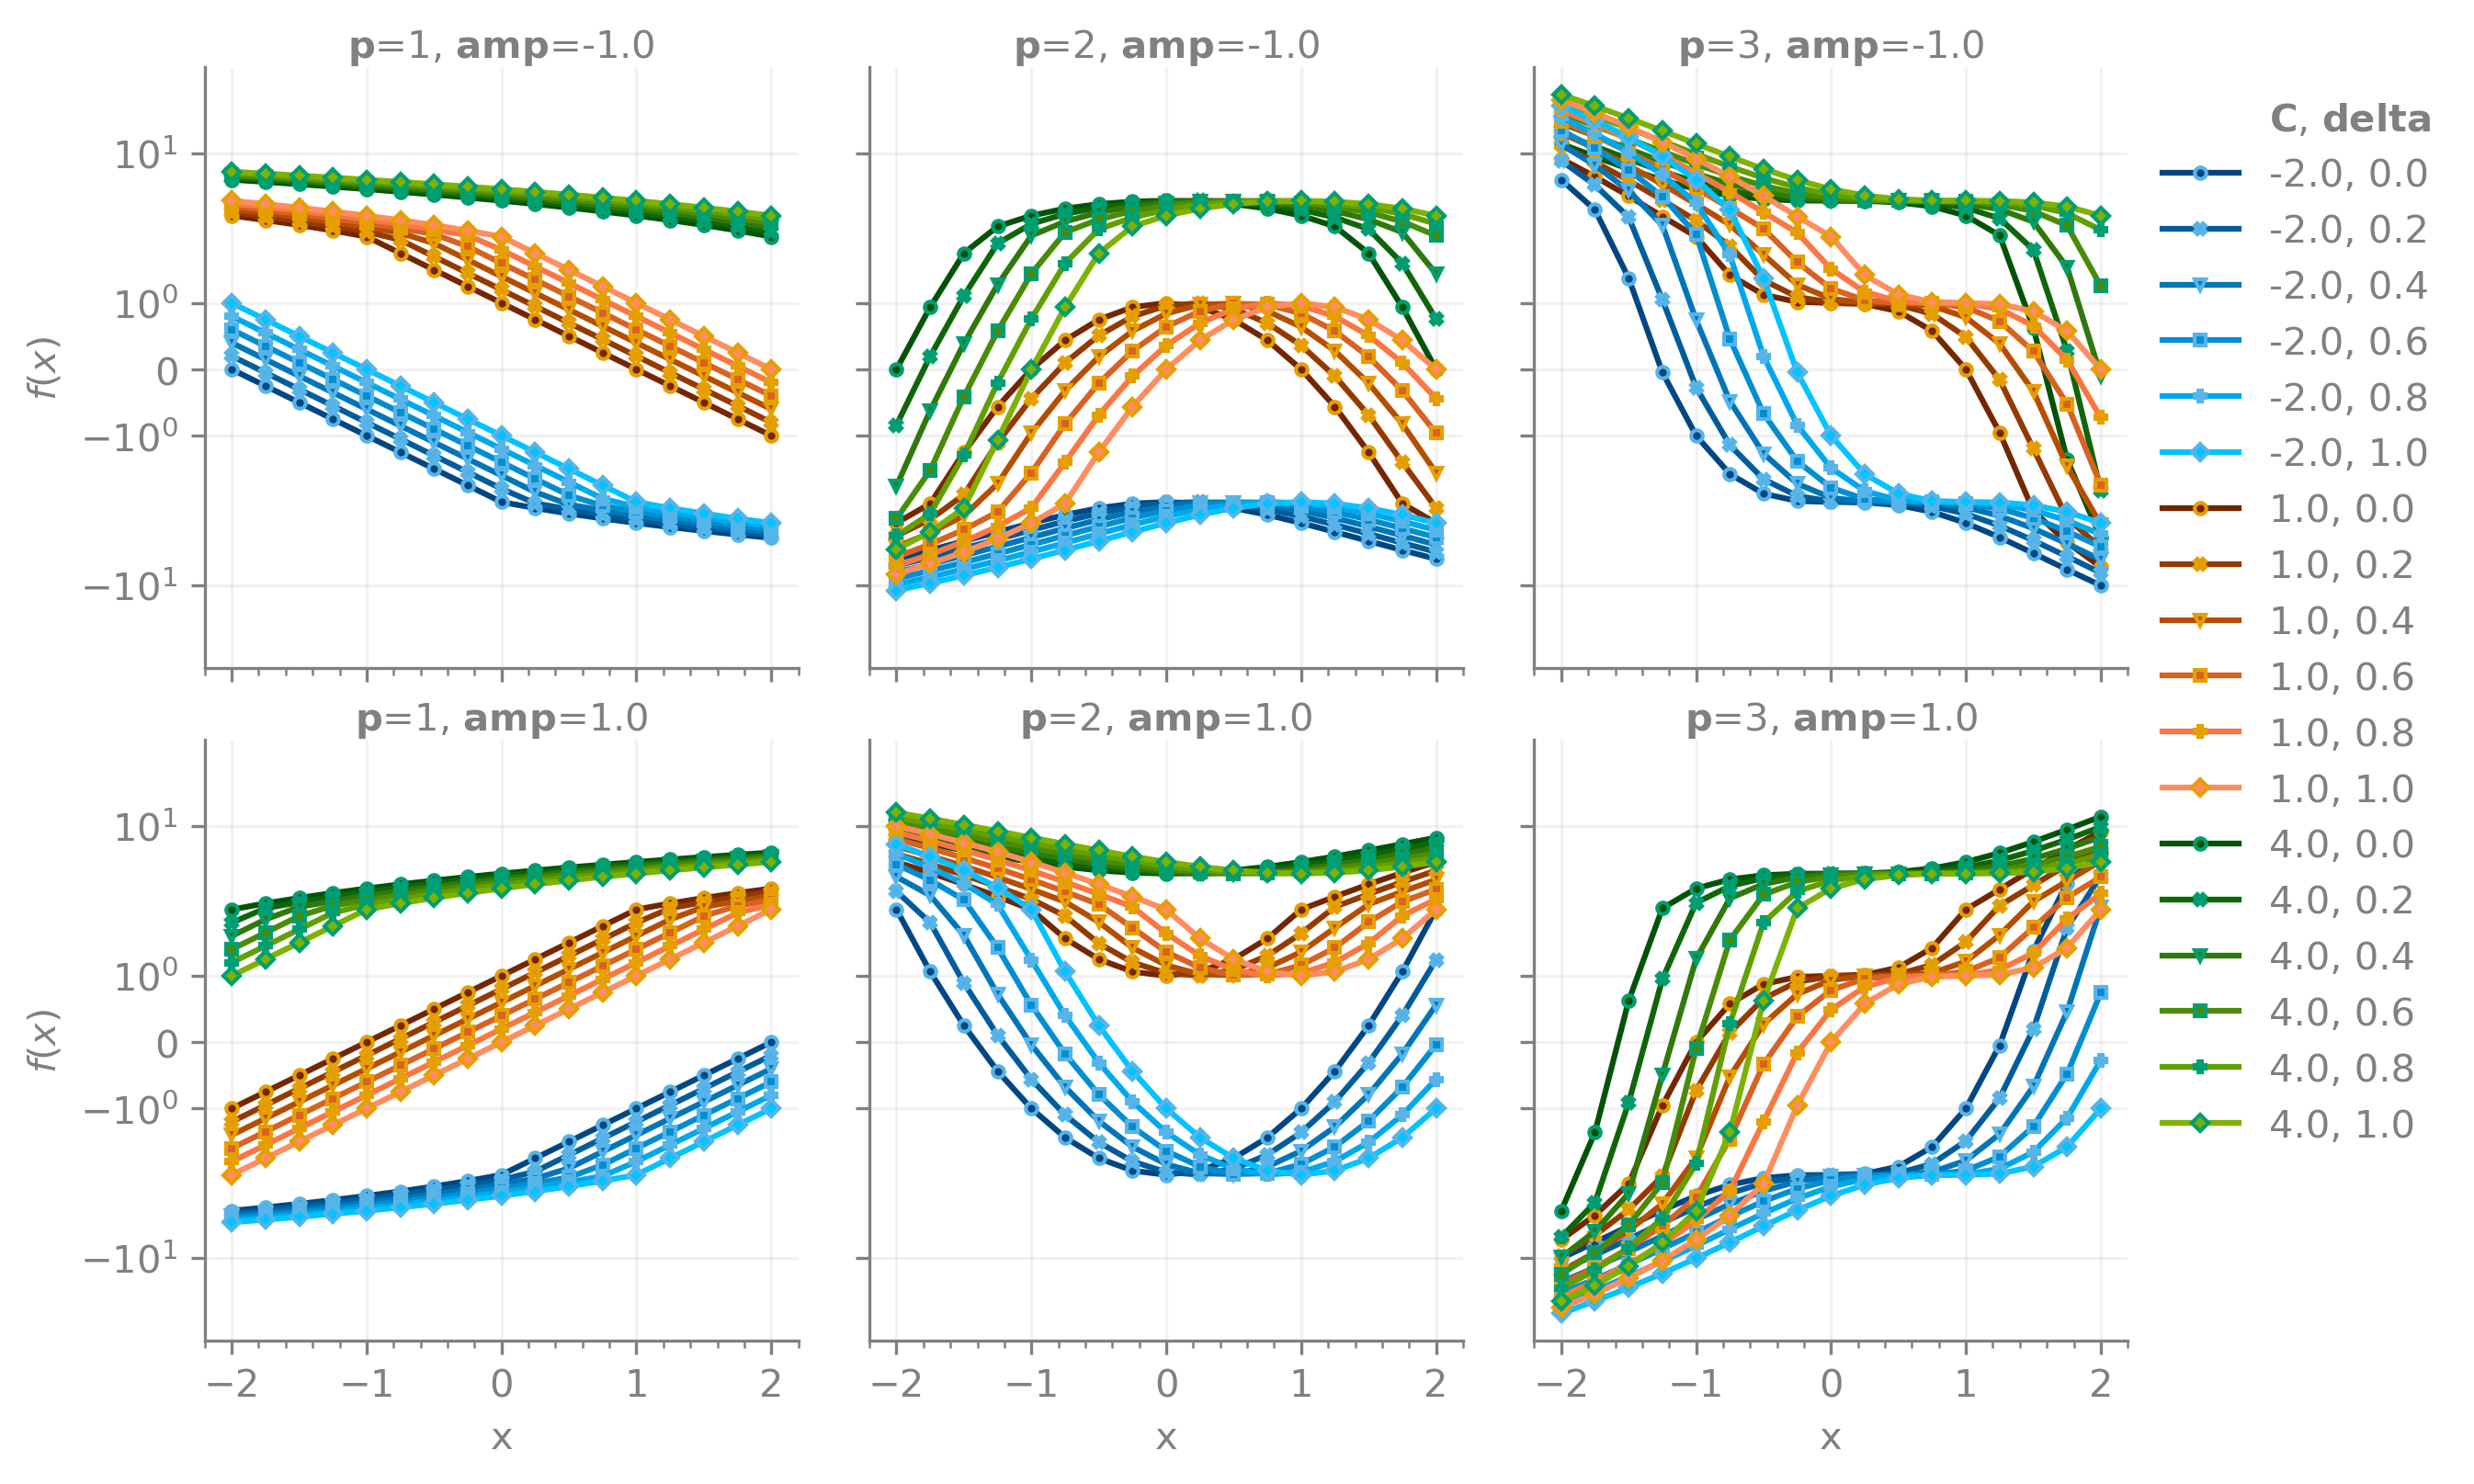
Here’s a simple example of generating and plotting a 5D function that uses the
high level driver xyz.cultivate() to handle a full cycle
of data generation:
import xyzpy as xyz

def foo(x, delta, p, amp=1.0, C=0.0):
    return {"fx": amp * (x - delta) ** p + C}

# cultivate!
# 0. annotate the function
# 1. write missing parameters combinations to disk ('sow')
# 2. compute those, with results stored persistenly to disk ('grow')
# 3. load results into a xarray.Dataset, merging with existing ('reap')
ds = xyz.cultivate(
    foo,
    # this specifies we'll return a dict of named data_vars ourselves
    var_names=None,
    # this specifies we'll harvest results to the file "foo.h5"
    data_name="foo.h5",
    # compute the outer product of these parameter combinations
    combos=dict(
        x=[-2 + i * 0.25 for i in range(17)],
        p=[1, 2, 3],
        delta=[0.0, 0.2, 0.4, 0.6, 0.8, 1.0],
        C=[-2.0, 1.0, 4.0],
        amp=[-1.0, 1.0],
    ),
)

# plot!
# - we can map pretty much any coordinate to any visual property
# - we can map to a palette ("hue") as well as position within that ("color")
fig, axs = ds.xyz.plot(
    x="x",
    y="fx",
    yscale="symlog",
    ylabel="$f(x)$",
    hue="C",
    markeredgecolor="C",
    color="delta",
    marker="delta",
    col="p",
    row="amp",
    markersize=3,
)

# clean up!
# - if we didn't delete the dataset, next run will only compute missing data
!rm foo.h5
Detailed Examples
These following examples are generated from the notebooks in docs/examples.
They demonstrate more complete usage or advanced features of xyzpy.
Development
Development
- Changelog
- v1.3.4 (2026-04-30)
- v1.3.3 (2026-04-30)
- v1.3.2 (2026-04-30)
- v1.3.1 (2026-04-29)
- v1.3.0 (2026-03-30)
- v1.2.1 (12th August 2021)
- v1.2.0 (12th August 2021)
- v1.1.0 (25th July 2021)
- v1.0.0 (24th October 2020)
- v0.3.1 (25th January 2019)
- v0.3.0 (21st January 2019)
- v0.2.5 (3rd December 2018)
- v0.2.4 (1st November 2018)
- v0.2.3 (4th October 2018)
- v0.2.2 (7th June 2018)
- v0.2.1 (27th May 2018)
- GitHub Repository
- API Reference